
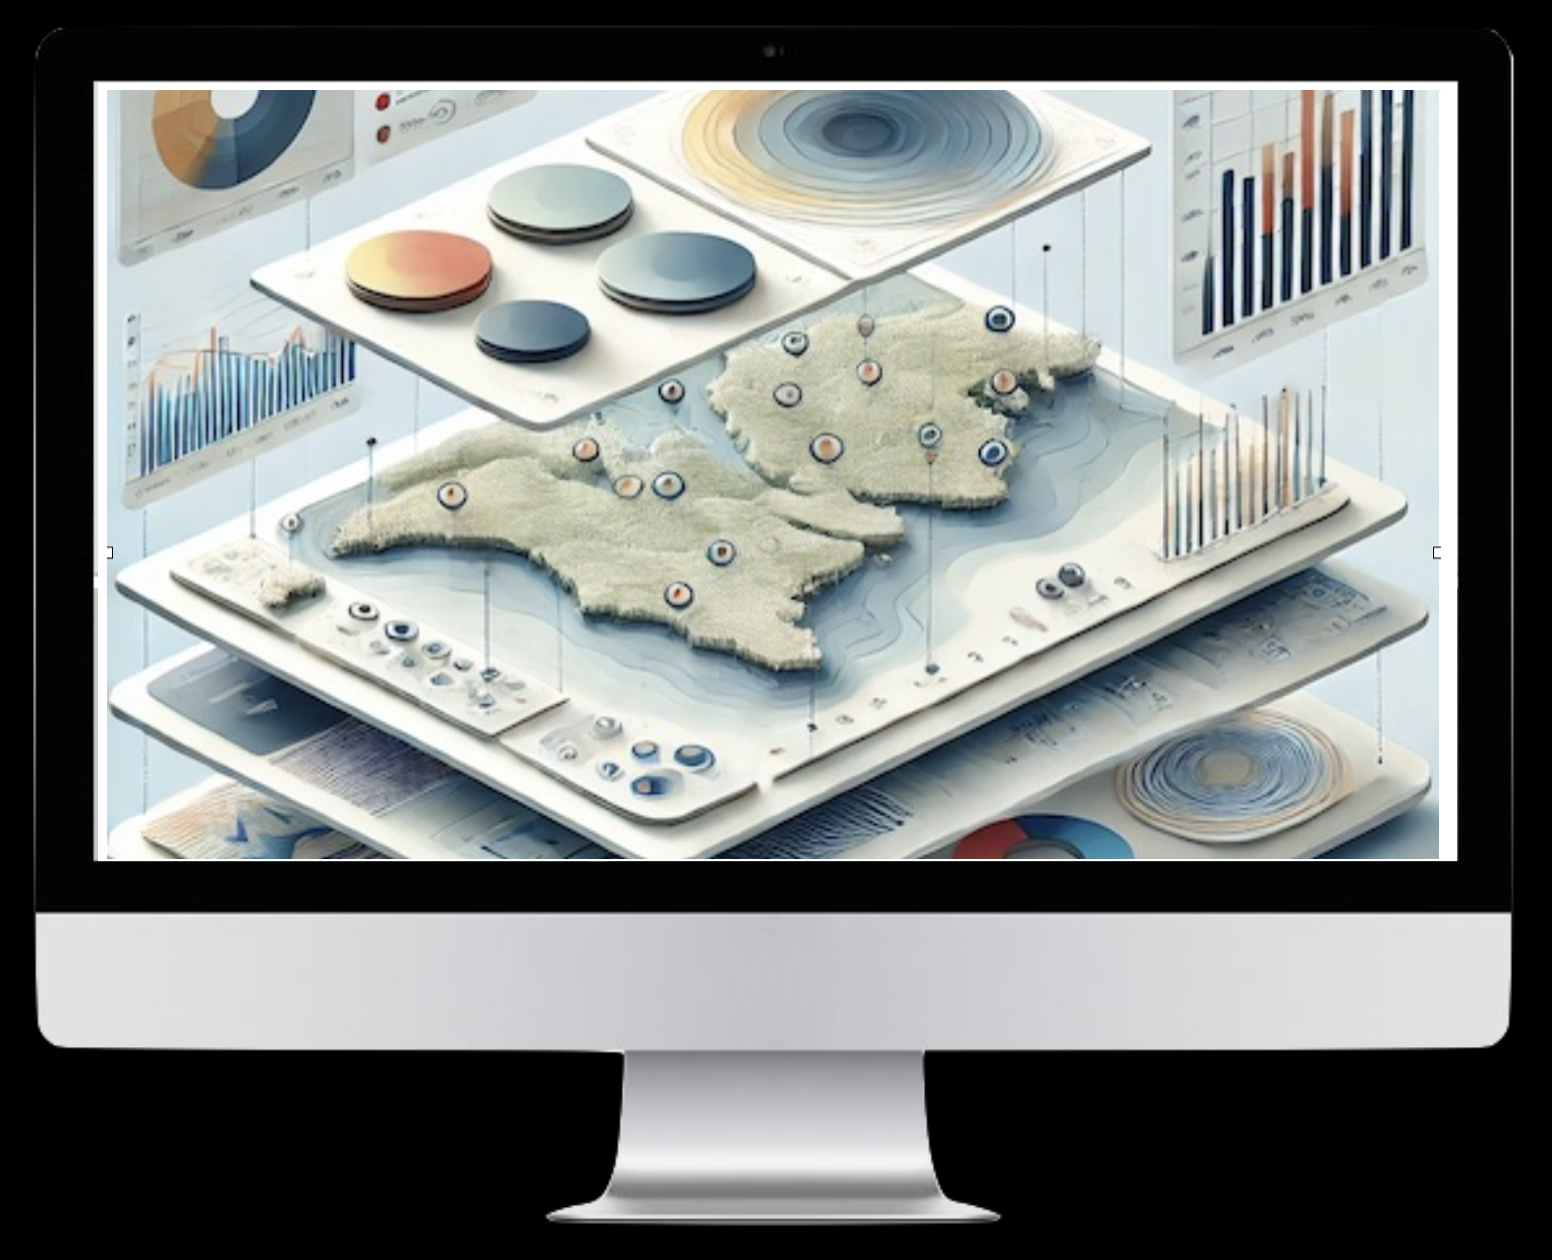
DataSphereX
A cloud-based platform designed to seamlessly analyze geospatial and attribute data, integrating machine learning, statistical modeling, and interactive visualization to deliver powerful tools for geospatial intelligence and beyond.
Platform Features
Contents Management
- Supports multiple data formats, including Shapefile, GeoJSON, CSV, PDF, and Images.
- Import, Export, Duplicate, and Delete Data
- Organize and manage data using tags.
- Connect to ESRI Map Service and WMS Service
- Modify Data Properties, including data name, data description, data tags, column name, column data type, and column order.
- Show data field statistics, show data in the table and on maps.
- Enable collaborative data management by adding comments to datasets.
- Generate Shapefiles from CSV files containing latitude/longitude fields or H3 hexagon index IDs.
- Facilitate data sharing within teams at group or organization levels.
- Oversee and manage dashboards and data portfolios
Account Settings
- Manage group members
- Join organizations
- Deposit funds into the account
- View payment history
- Configure Google Maps API Key and Mapbox Access Token
- Monitor ongoing calculation requests and review completed requests from the past 24 hours
Analytics Modules
MapVIZ
Your all-in-one solution for interactive mapping and data visualization. MapVIZ enables you to layer maps, apply filters, perform group-by statistics, and generate dynamic charts. Visualize data through heatmap, bubble map, and classification by numeric and categorical values. Integrate seamlessly with basemaps, locate addresses effortlessly, and manage both spatial and attribute data.
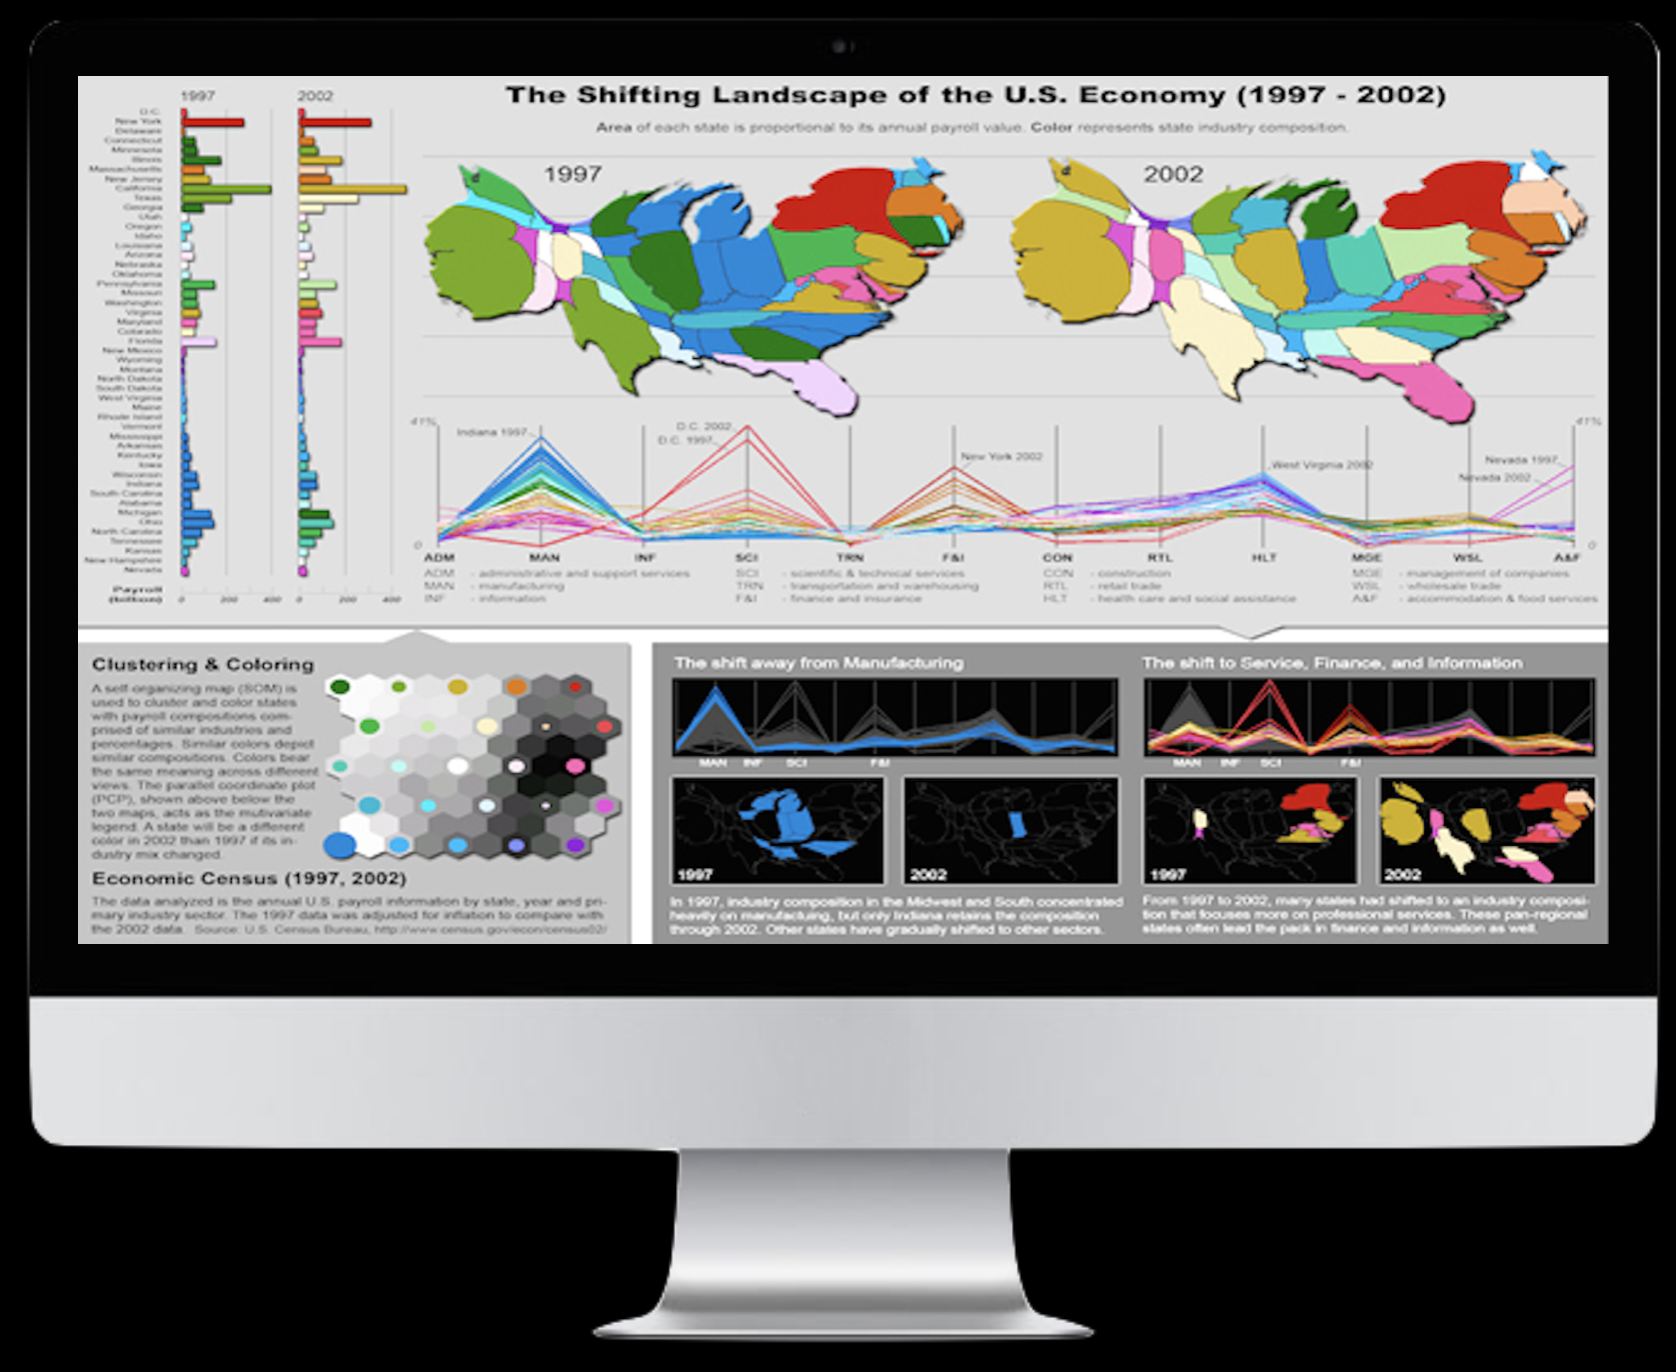
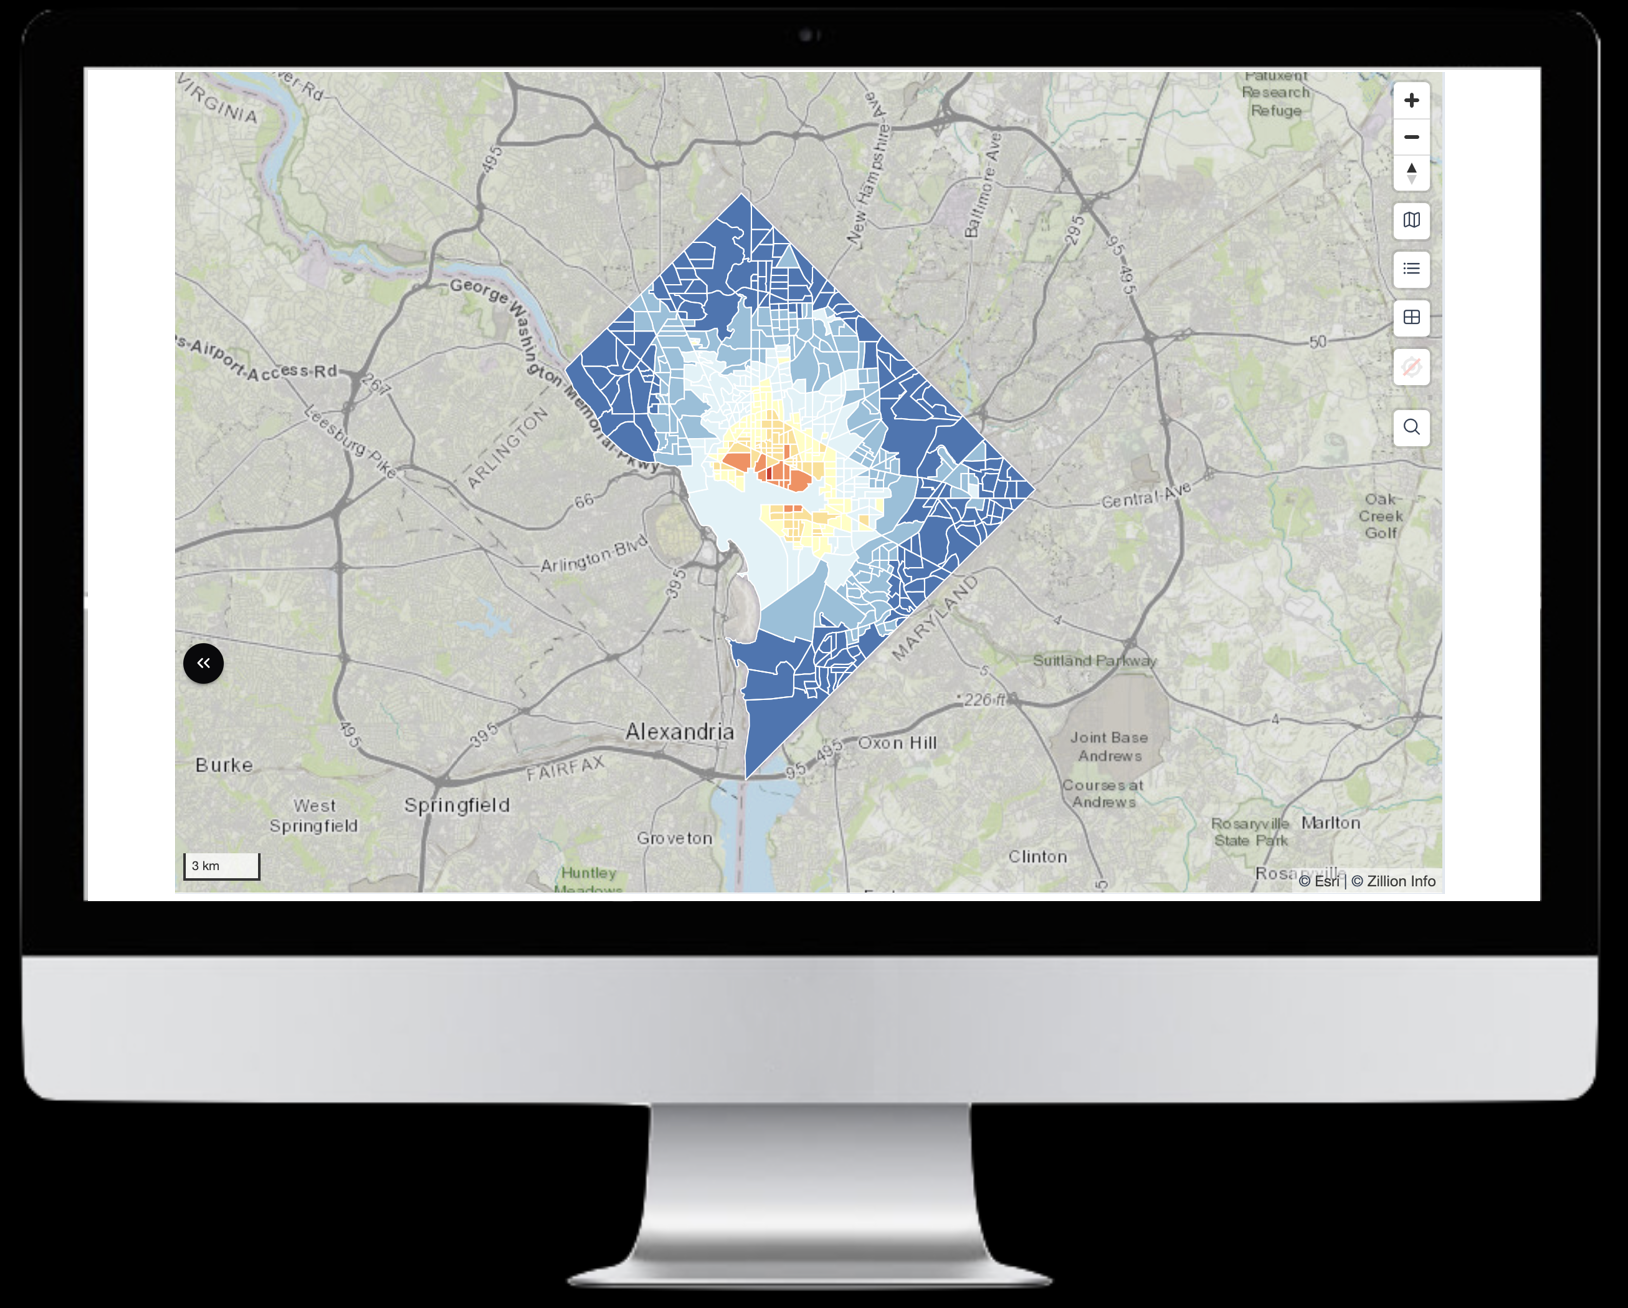
SOMVIS: Multivariate Clustering, Mapping, and Statistics
SOMVIS integrates clustering algorithms, interactive maps, and visual analytics to reveal natural patterns in multivariate data. It enables users to compute, visualize, and compare clusters effortlessly while dynamically exploring statistical relationships. Designed primarily for numerical analysis, it also supports categorical data visualization through interactive maps and charts. Combining computational and visual methods, SOMVIS simplifies complex data patterns for intuitive discovery.
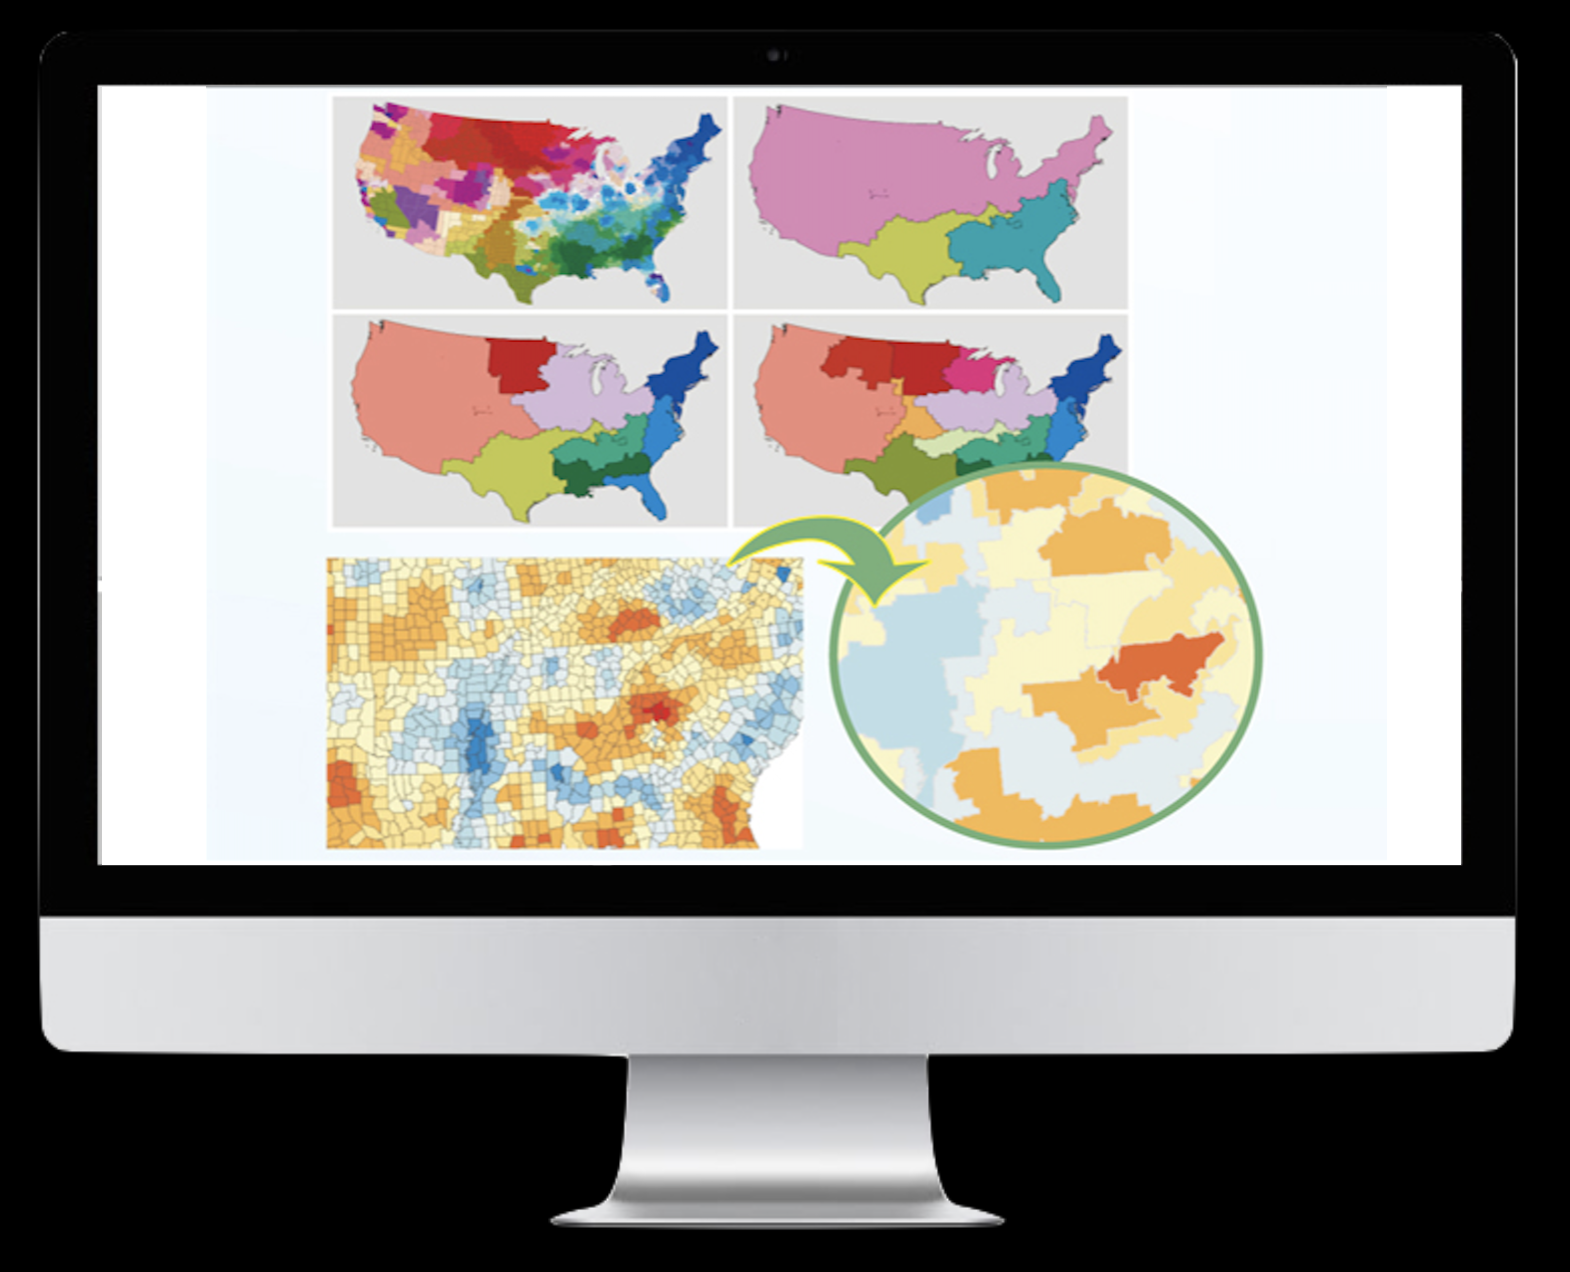
REDCAP: Multivariate Hierarchical Regionalization
REDCAP is an online tool designed for aggregating large sets of spatial objects into contiguous regions while optimizing homogeneity or heterogeneity measures. It ensures spatial contiguity, enforces constraints like minimum region size, and preserves meaningful patterns while reducing random effects. REDCAP supports diverse applications, including majority-minority zone detection, market segmentation, insurance rate zoning, and disease mapping. With powerful optimization, efficiency in large-scale data processing, reproducibility, and an intuitive interface, REDCAP provides a seamless solution for spatial regionalization and analysis.
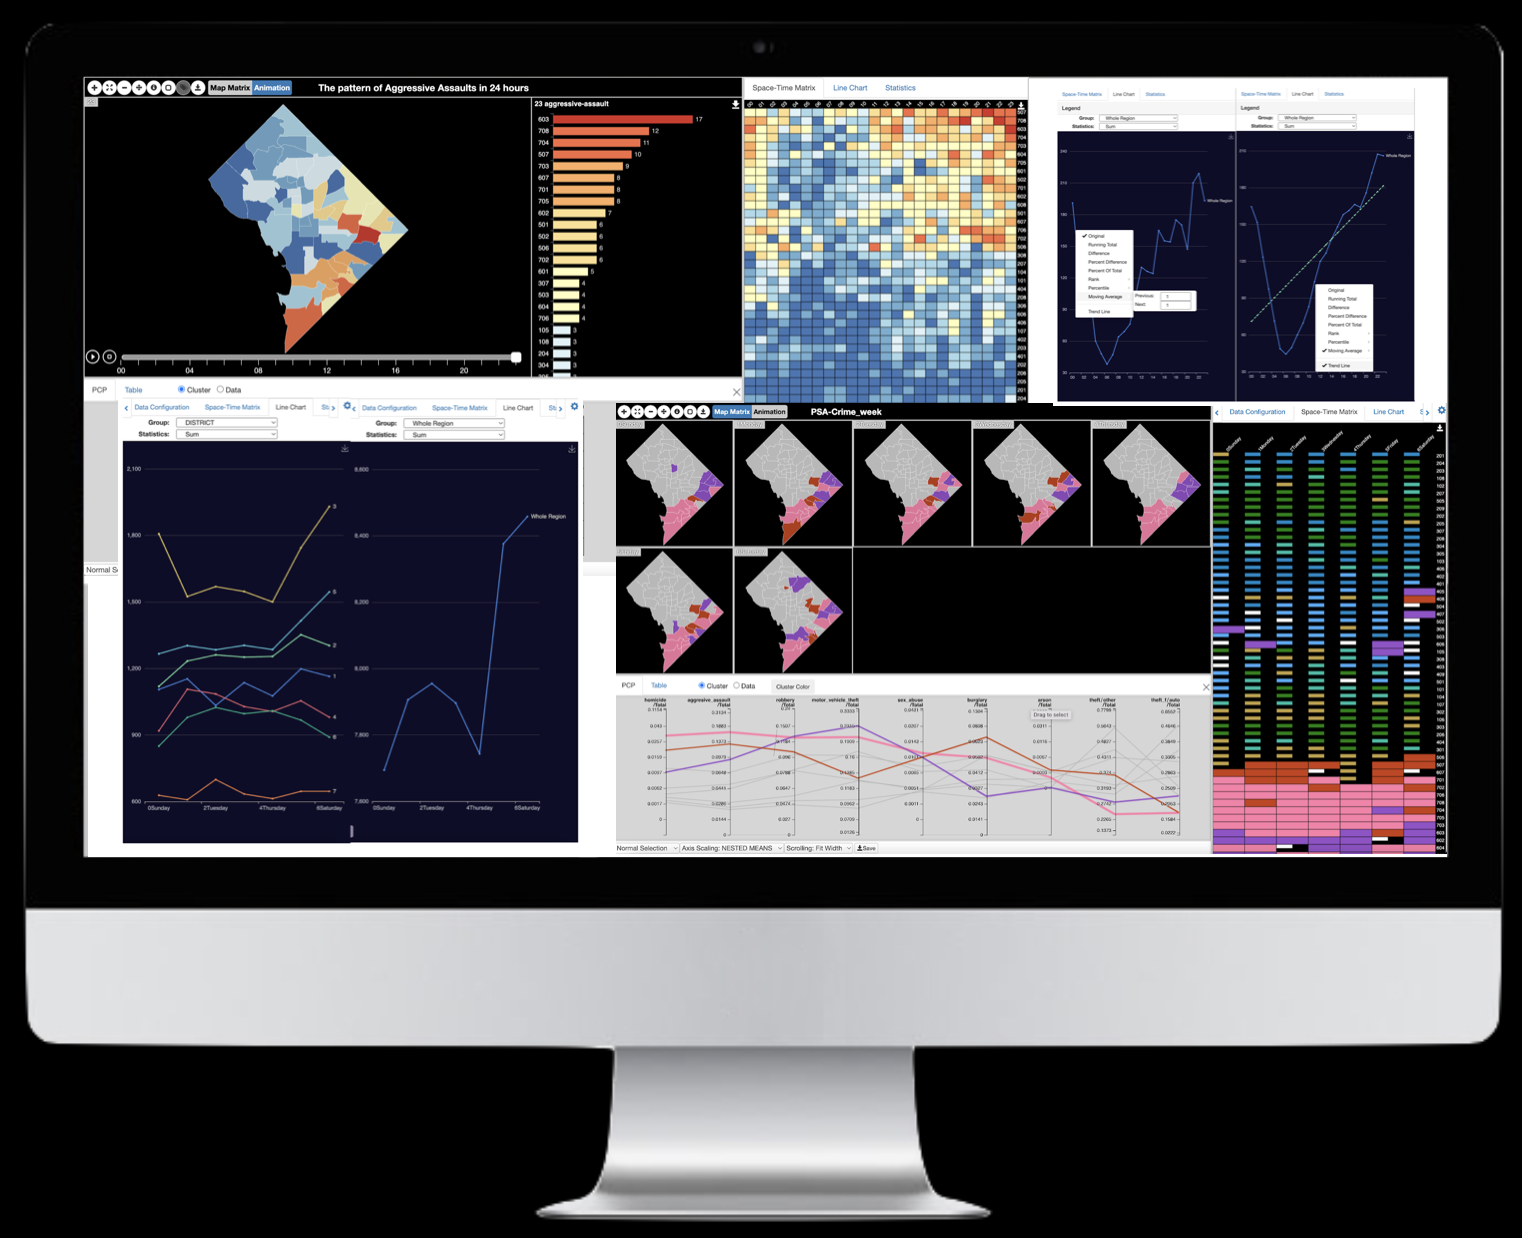
VIS-STAMP: Spatial Temporal Insights
VIS-STAMP is a powerful software package designed for exploring and visualizing complex spatial-temporal patterns in multivariate data. It seamlessly integrates advanced analytics with interactive maps and charts, enabling intuitive interpretation and decision-making without requiring extensive programming skills. Featuring tools like map animations, space-time matrices, time series charts, and parallel coordinate plots, VIS-STAMP enhances data exploration from multiple perspectives, making it an essential tool for analytical reasoning and efficient spatial-temporal analysis.
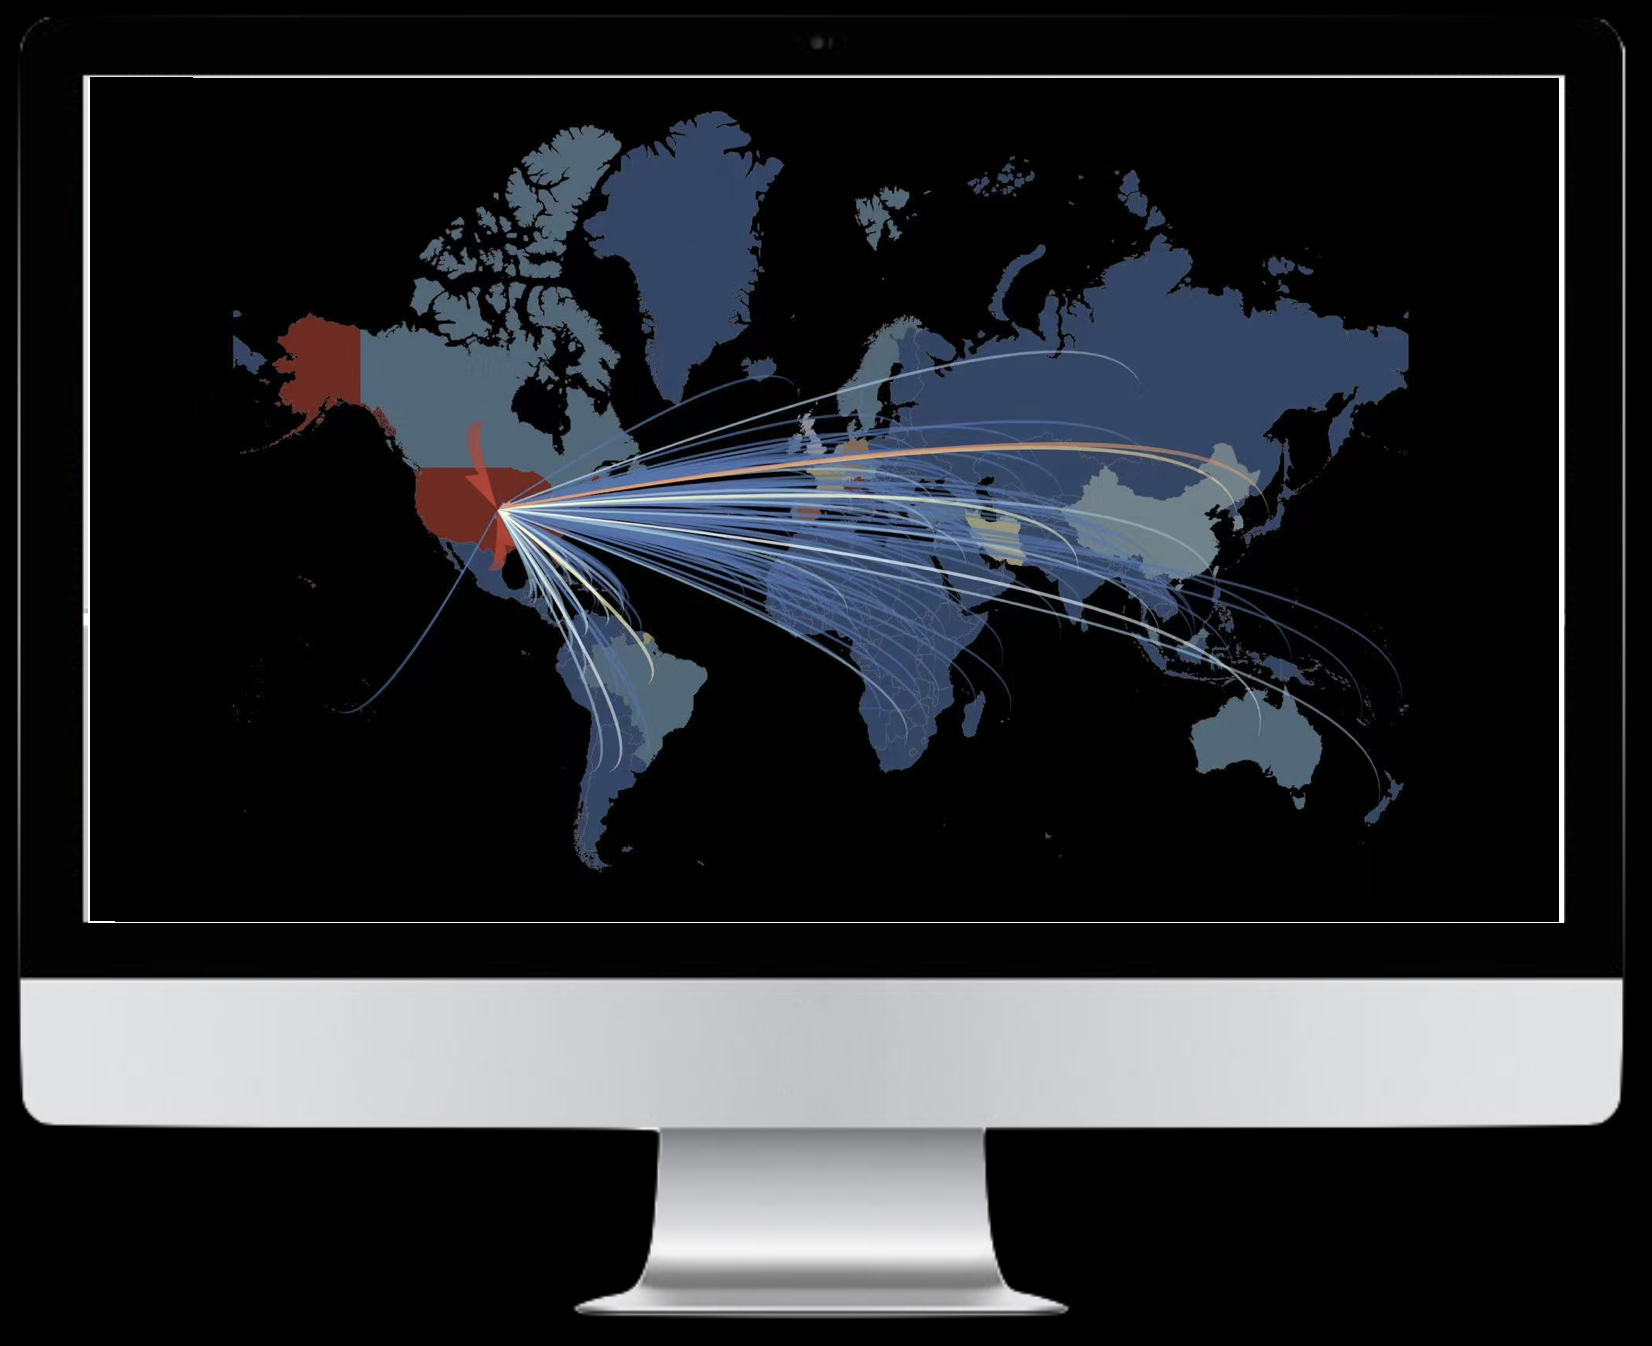
Flow Mapping
Flow Mapping in Flow Analytics provides powerful tools for visualizing and analyzing spatial flows between locations using volume-based classification, color gradients, and animations. It includes node measurements to assess network dynamics, such as Flow (volume/intensity), Degree Centrality (connection importance), In-Degree and Out-Degree Centrality (incoming and outgoing links), PageRank (node significance), Betweenness Centrality (network bridging role), Closeness Centrality (proximity to other nodes), and Clustering Coefficient (node clustering tendency). Users can explore spatial interactions in depth and share results through interactive dashboards, making it an essential tool for spatial network analysis.
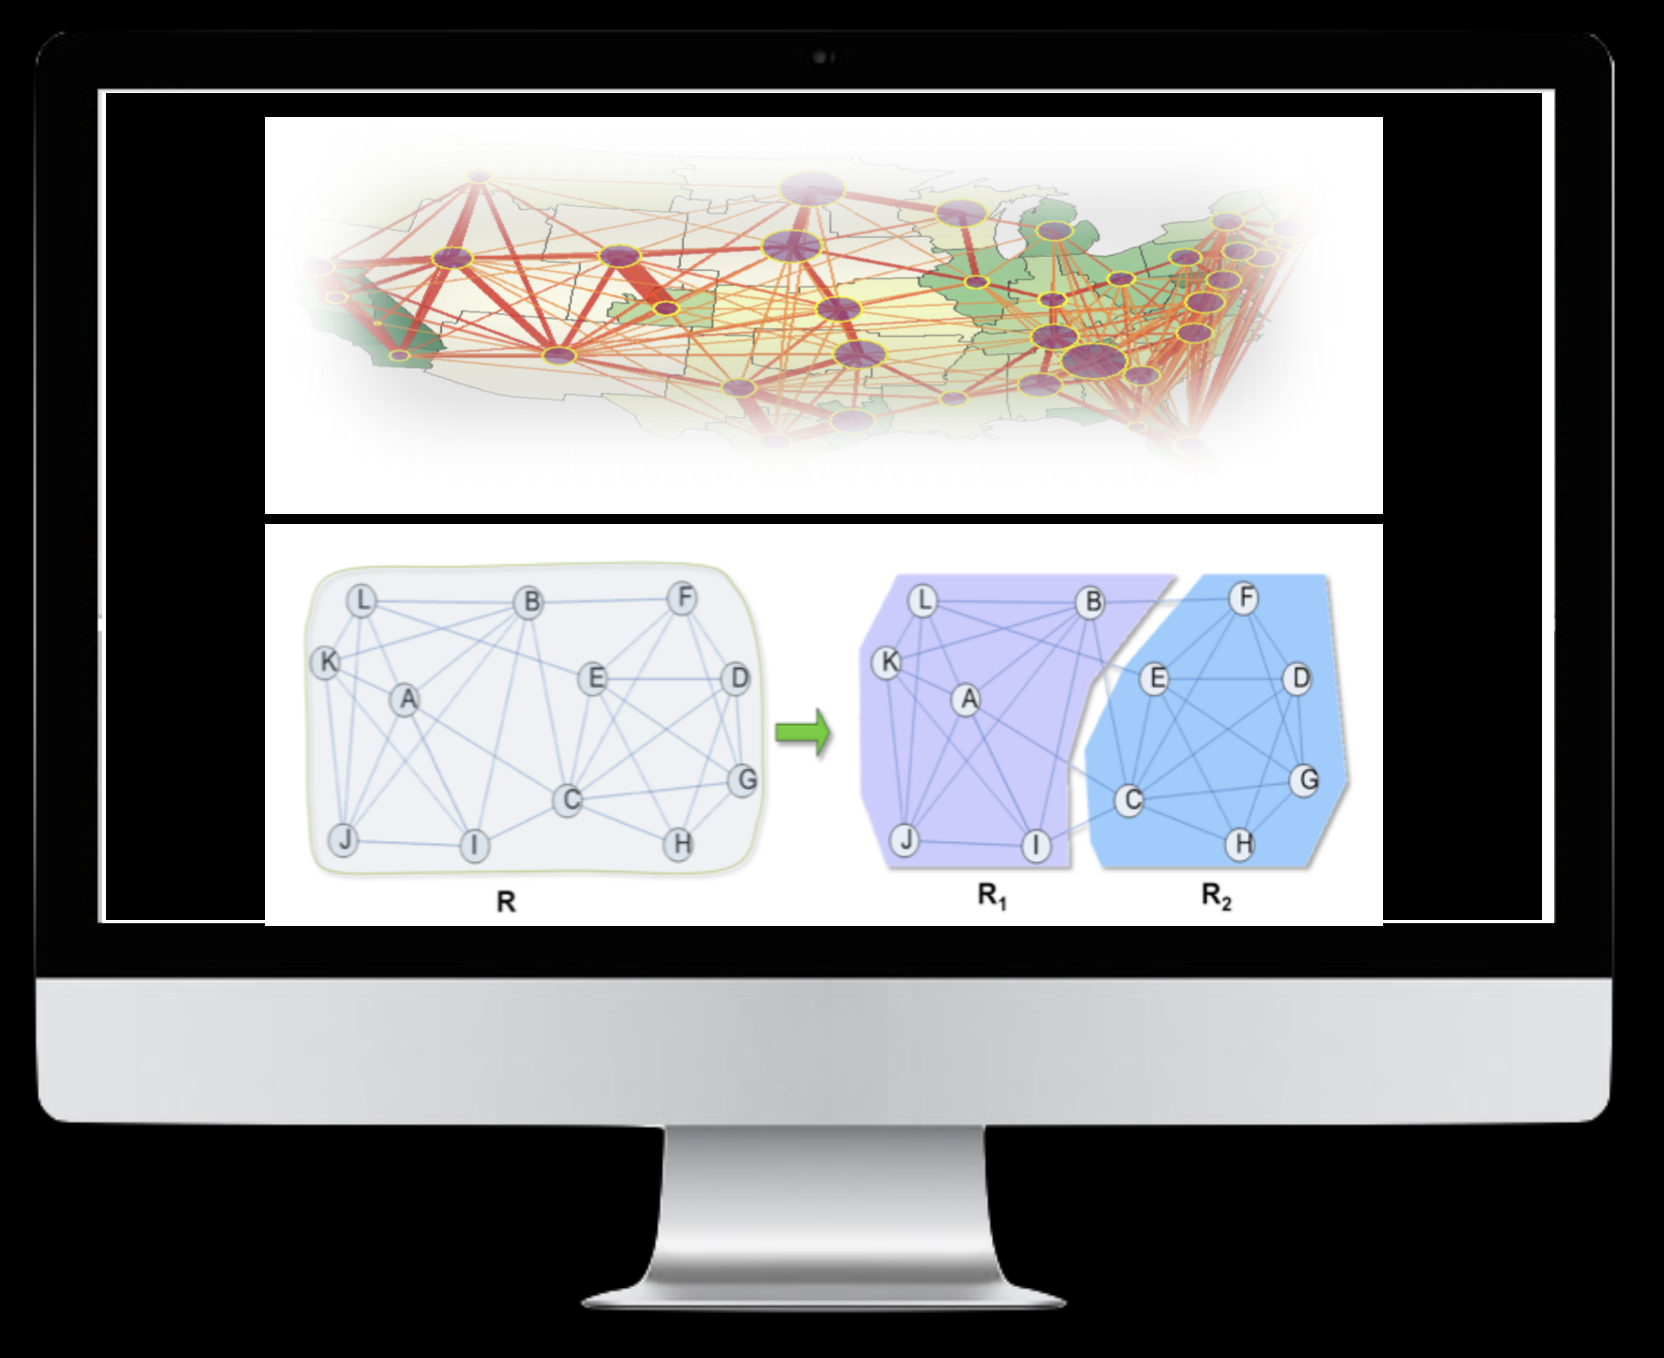
Flow Regionalization
Flow Regionalization applies spatially constrained graph partitioning to define natural regions based on flow dynamics. By analyzing the intensity and direction of flows, this method segments areas with strong internal connectivity, revealing hierarchical spatial structures. Using modularity measures, it compares actual versus expected flows to identify regions with high internal cohesion. This approach provides a structured, data-driven understanding of spatial interactions, supporting advanced regional analysis and decision-making.
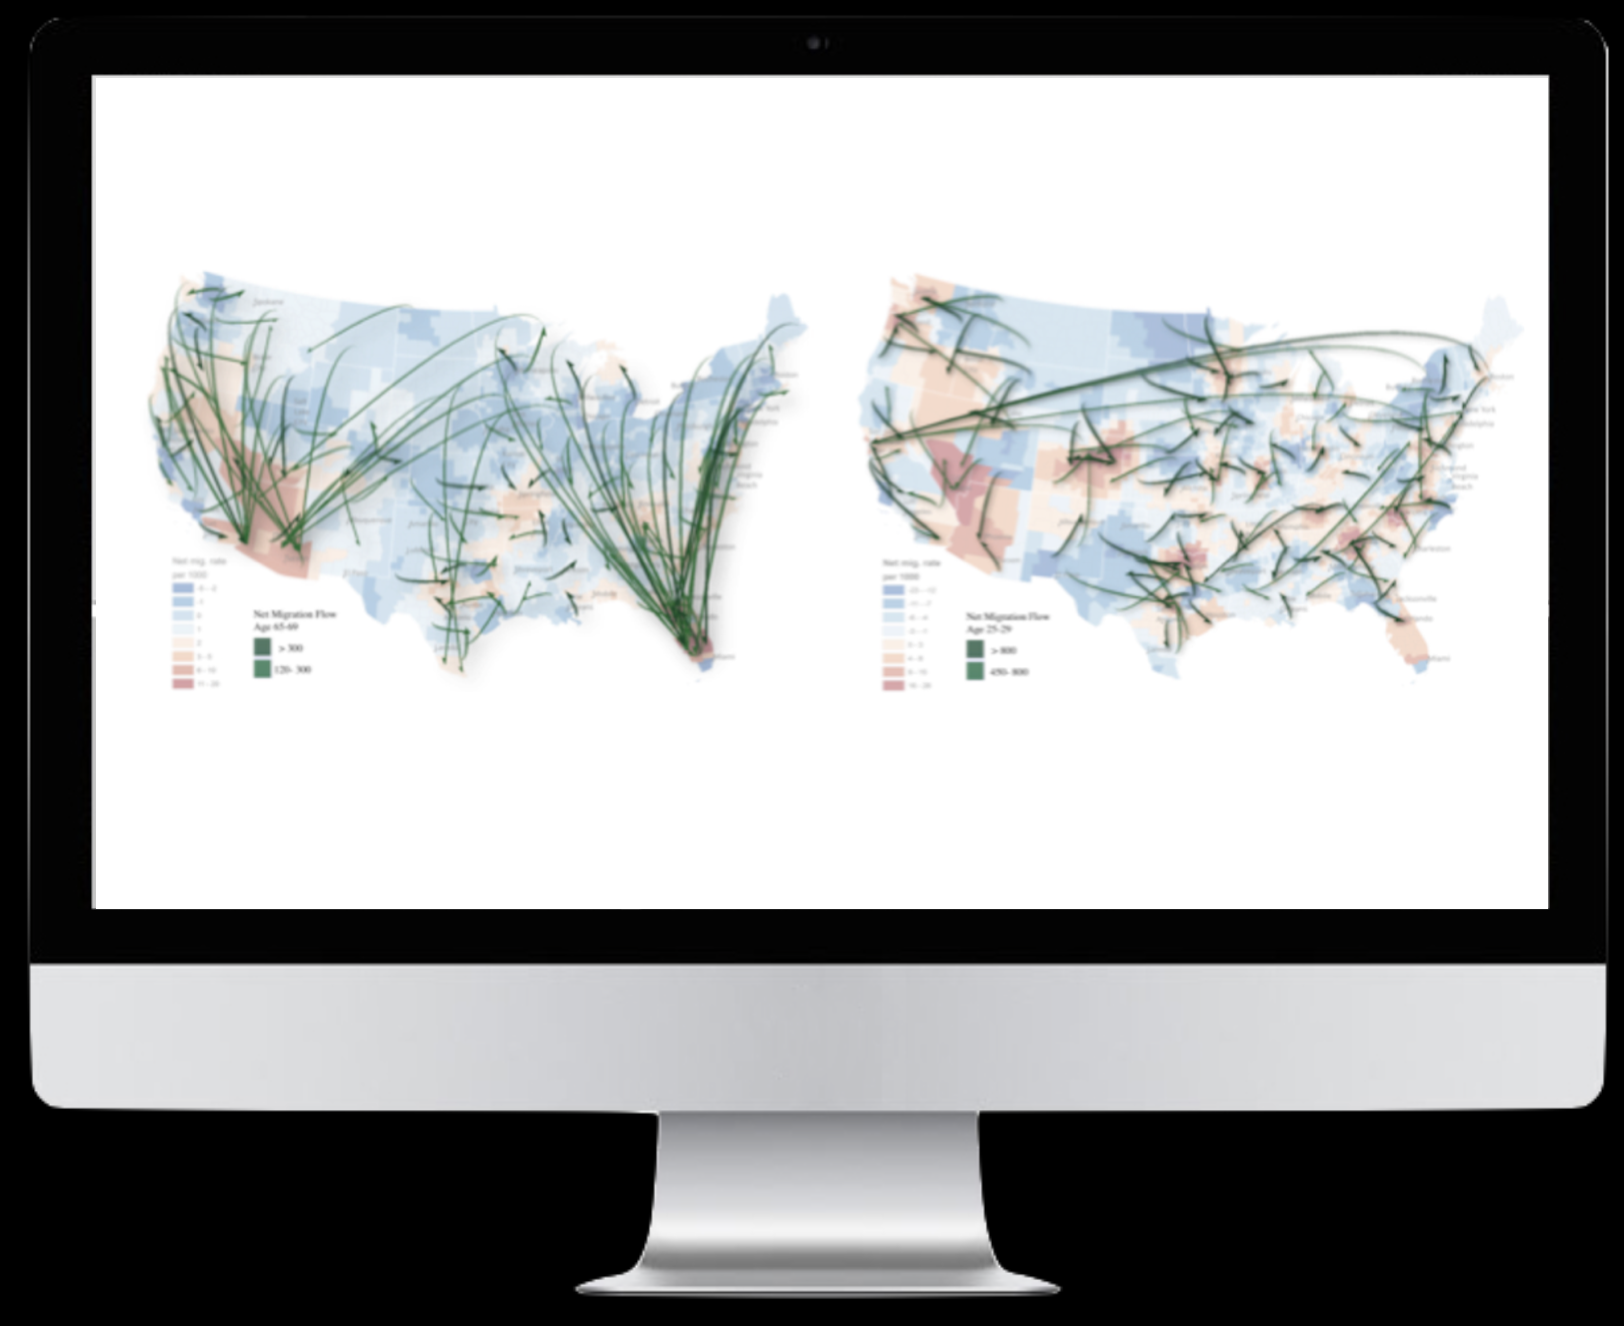
Flow Clustering
Flow Clustering identifies statistically significant flow clusters using flow scan statistics and the Log-Likelihood Ratio (LLR) model. Each cluster represents flows between specific start and end areas, revealing key spatial interactions. These clusters vary in size (larger vs. smaller origin-destination areas) and flow length (longer vs. shorter connections), providing a detailed view of movement patterns and spatial connectivity within the data.
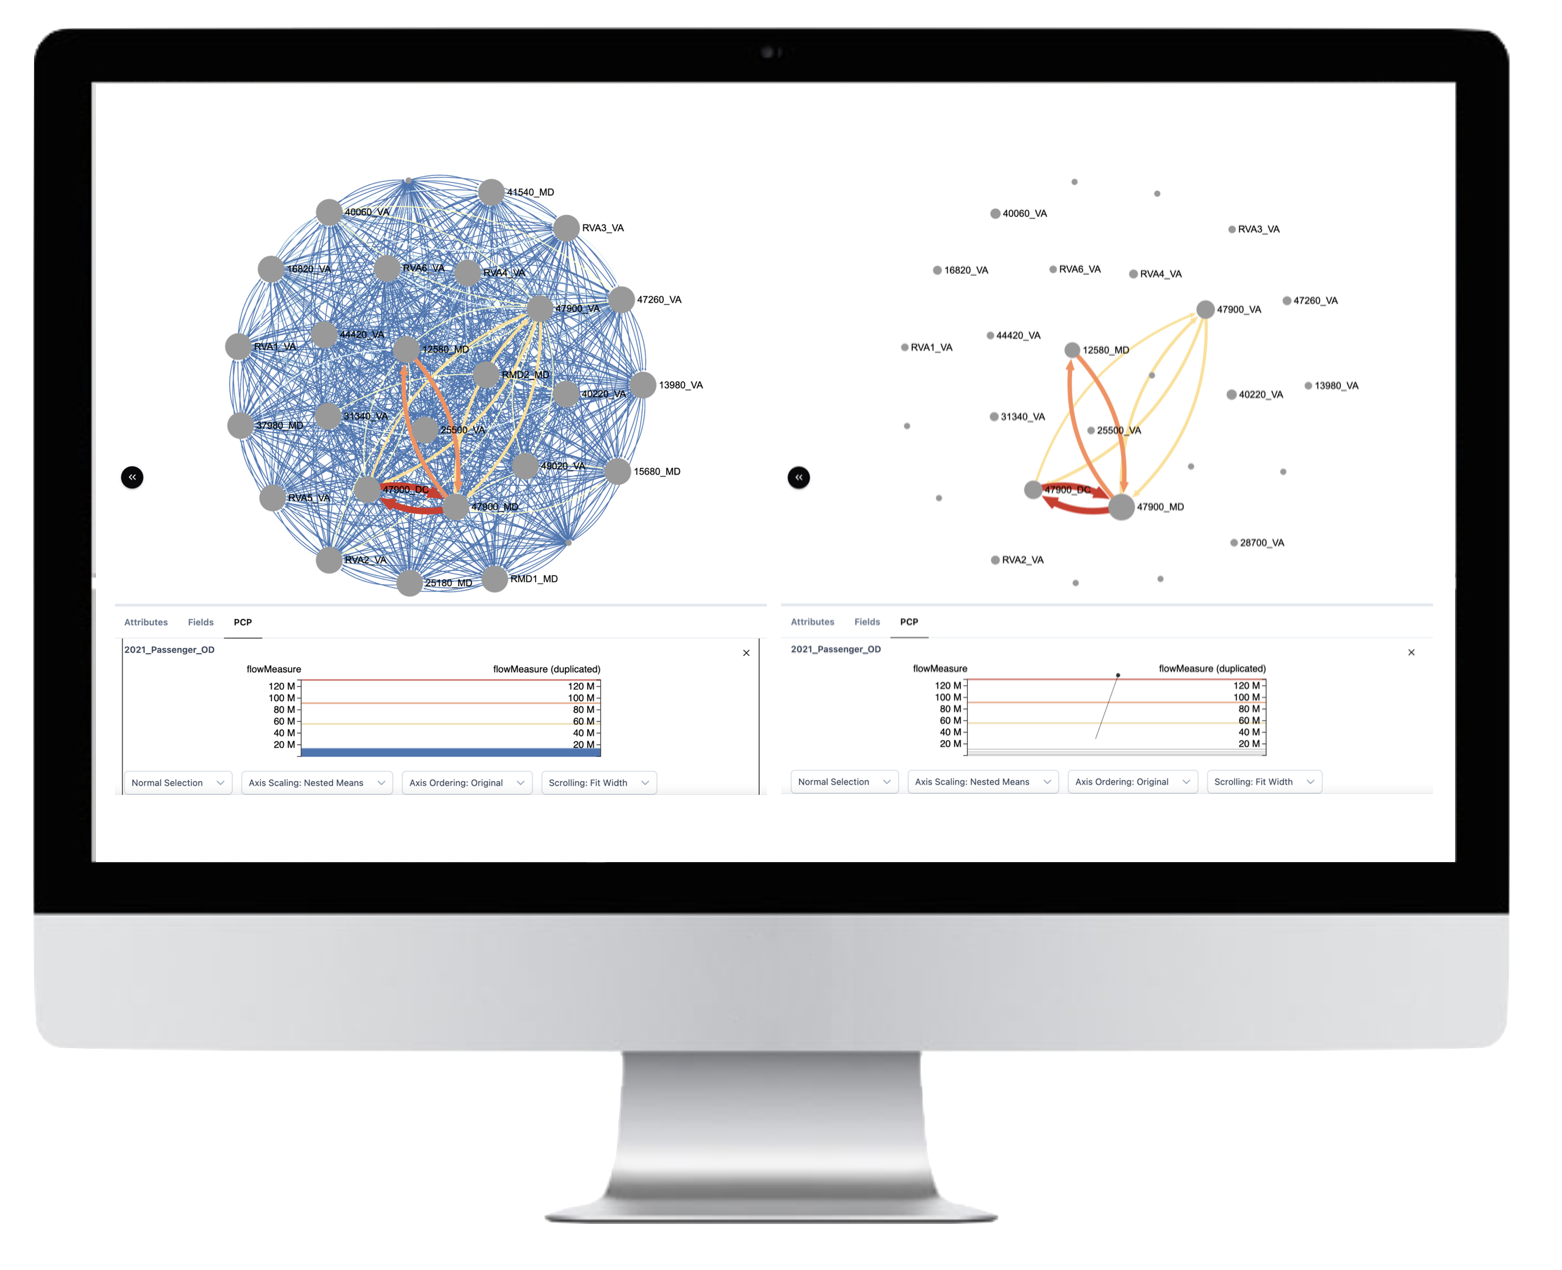
Graph Analytics
Powerful tools for analyzing network structures and relationships. Perform advanced graph analytics, calculate network metrics, and visualize complex network relationships. Ideal for social network analysis, transportation networks, and infrastructure planning.
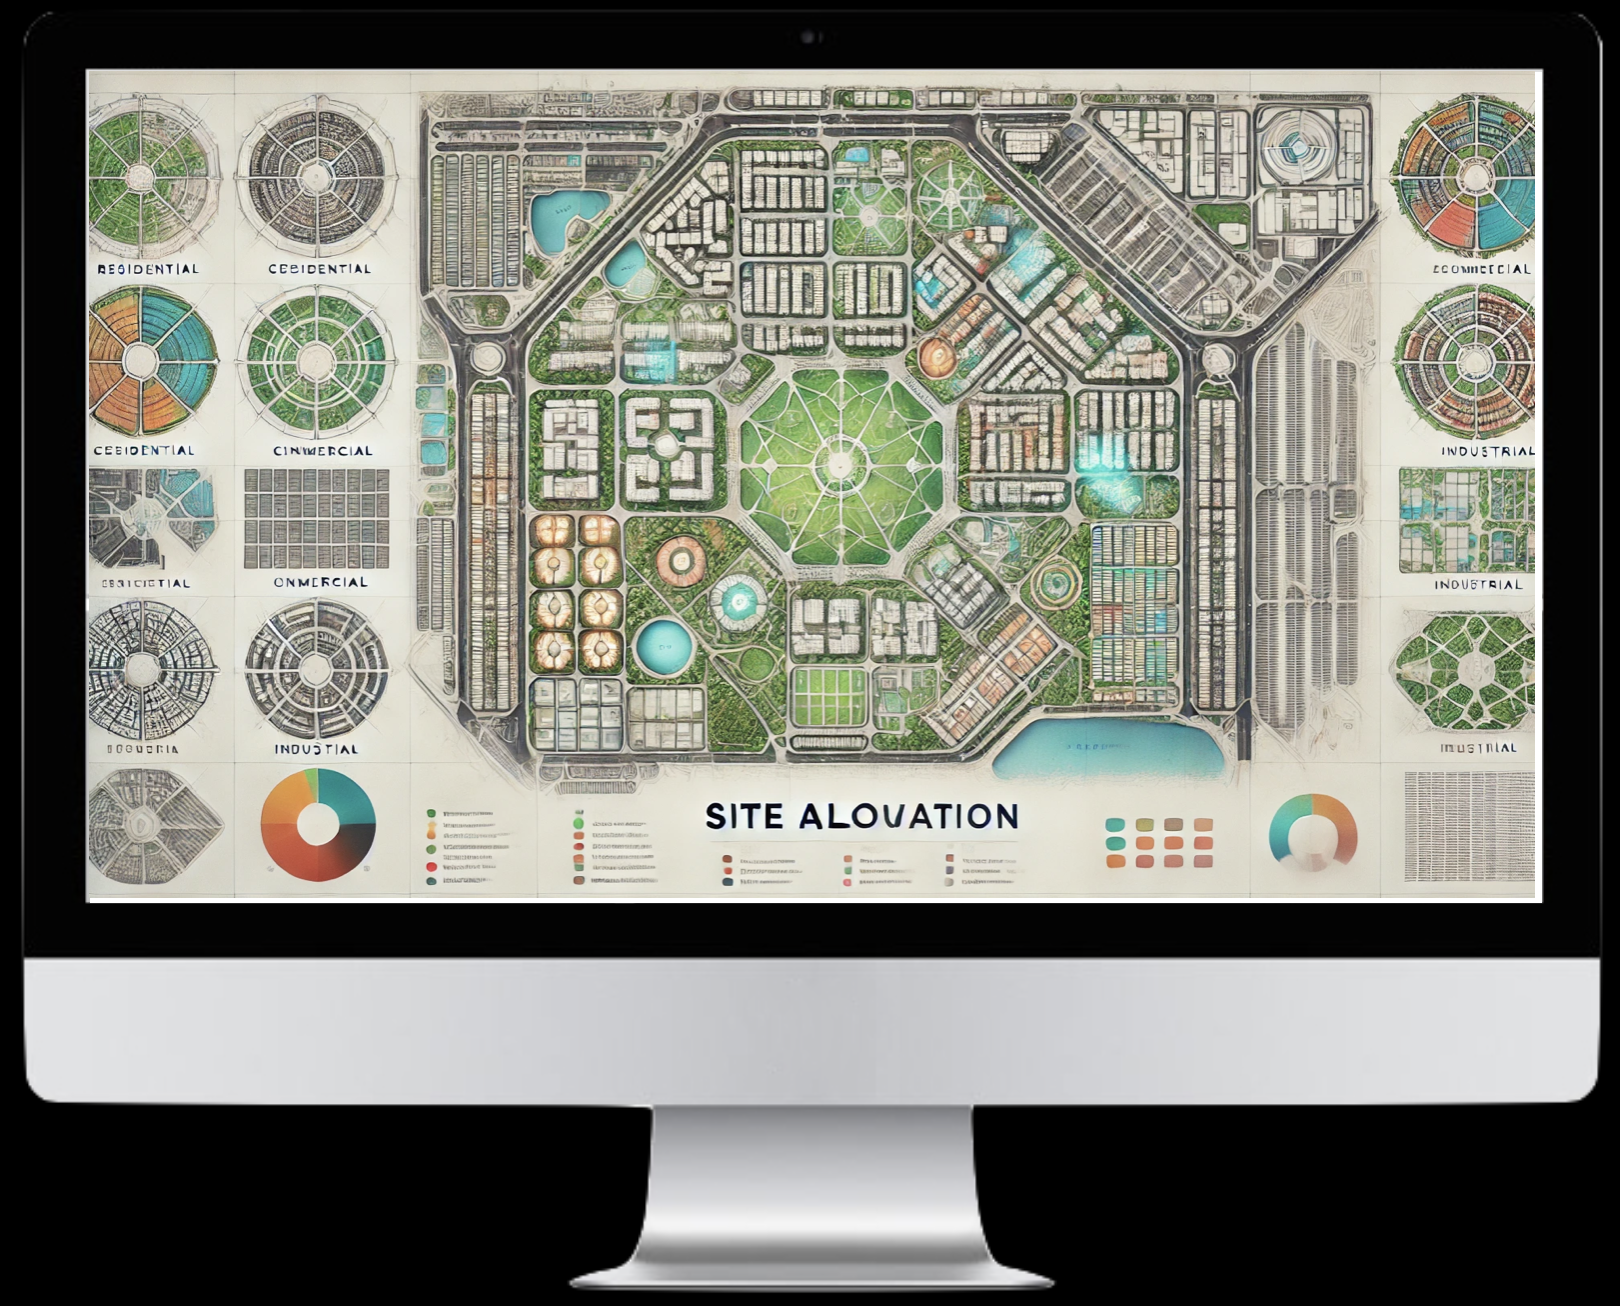
Site Allocation
Optimize location decisions with advanced site allocation tools. Find optimal locations for facilities, balance service coverage, and analyze accessibility. Includes location-allocation models, coverage analysis, and service area optimization.
Accessibility Analysis
Comprehensive tools for analyzing spatial accessibility and service coverage. Calculate travel times, evaluate service areas, and assess the impact of location decisions on accessibility. Essential for urban planning, service delivery optimization, and equity analysis.

Predictive Analytics
Leverage machine learning and AI for spatial prediction and forecasting. Build predictive models, identify spatial patterns, and make data-driven forecasts. Includes tools for spatial regression, machine learning, and predictive modeling.
Toolbox
Data Processing
- Coordinate Transformation
- Join
- Field Calculation
- Filtering
- Clip
- Intersect
- Select By Location
- Merge
- Split
- Centroid
- Data Cleaning
Data Aggregation and Transposing
- Attribute Aggregation
- Space-Time Aggregation
- Time Aggregation
- Flow Aggregation
- Apportion
- Transpose Fields
- Pivot Table
- Spatial Join and Aggregation
- Dissolve
Spatial Analysis
- Gridding
- Isodistance
- Thiessen Polygon
- Interpolate
- Entropy
- GWR
Other
- Geocoding
- Distance Matrix