MapVIZ
Interactive visualization platform for geospatial data analysis and insights
Key Features
Powerful tools for creating interactive maps and visualizations
Interactive map layering and visualization
Dynamic filtering and group-by statistics
Heatmap and bubble map visualization
Numeric and categorical value classification
Seamless basemap integration
Address location and geocoding
Spatial and attribute data management
Real-time data updates and synchronization
Custom styling and theming options
Export and sharing capabilities
Visualization Types
Create compelling visualizations that bring your data to life
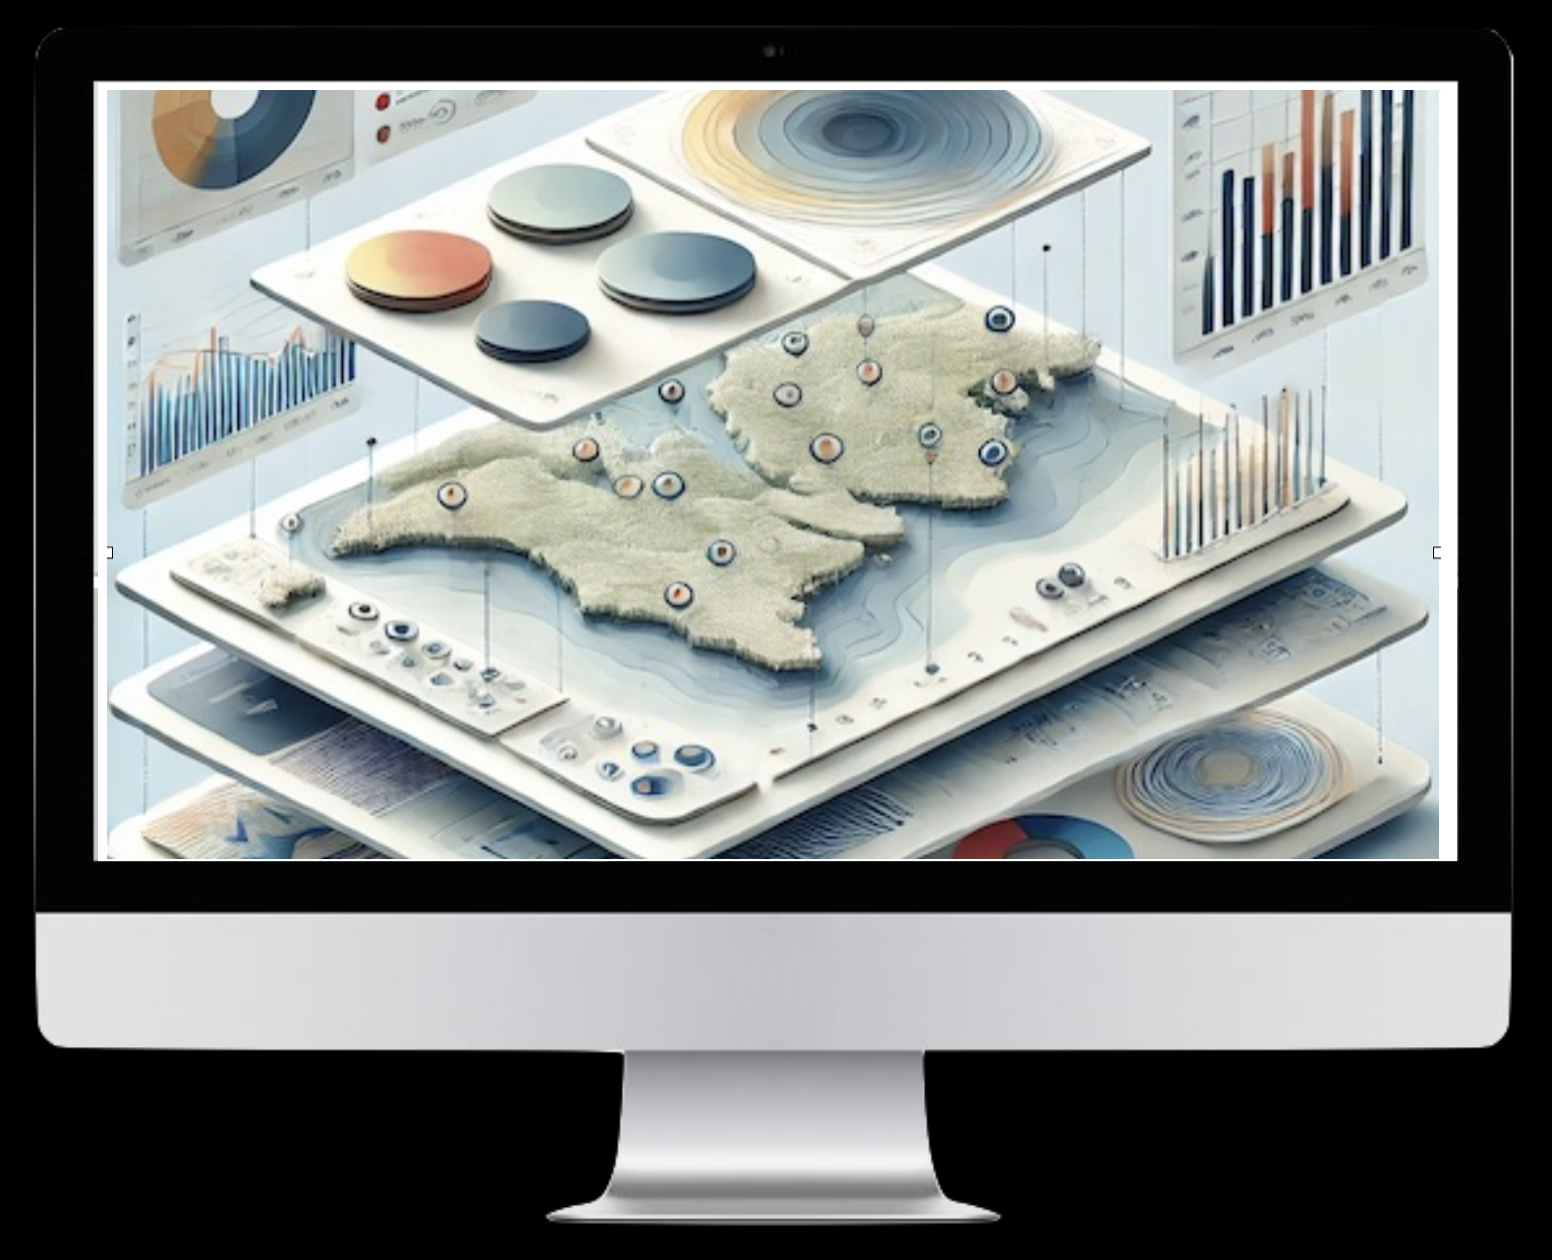
Thematic Maps
Create compelling thematic maps using various classification methods and color schemes.
Heat Maps
Visualize density and intensity patterns with customizable heat map overlays.
Bubble Maps
Represent quantitative data with proportional symbols and bubbles.
Statistical Charts
Generate dynamic charts and graphs linked to your spatial data.